

School board trustees OK with Harvard’s COVID-19 data
By Eric Valentine
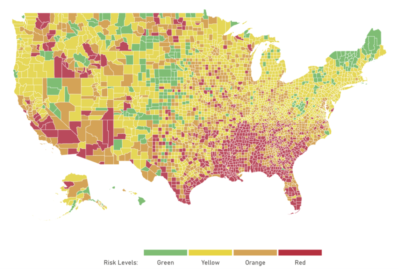
Rumblings around the school district about the use of a Harvard University COVID-risk map to determine which teams Blaine County schools can safely compete against triggered a lengthy discussion by school board trustees, district administrators and county health experts at an Aug. 31 meeting.
It also triggered a nearly 1,000-word letter of explanation by Zone 5 Trustee Lara Stone, vice chair of the board who has been one of the more steadfast trustees when it comes to an err-on-the-side-of-safety approach. In the letter, Stone summarized the six key reasons BCSD opted for the Harvard Global Health Institute (GHI) metric rather than the one put forth by South Central Public Health District (SCPHD).
Among the reasons are timing and purpose. Specifically, the timing of the local health district data can sometimes be nearly two to three weeks delayed, whereas Harvard’s is at most a few days off. In addition, the purpose of the localized data is to help mitigate COVID spread, the purpose of Harvard’s data is to help suppress it. Trustees are hoping that if sports teams follow a rigorous safety protocol developed by the district administrators and based on the Harvard data, student athletes will be able to compete against other schools safely or know when it’s too risky.
“This is not a strategy to eliminate all risk. The only way to do that is to not play sports,” Stone said. “And I think it’s really clear that we want kids out playing, and competing if possible.”
What follows are excerpts from Stone’s six-point explanation:
SCIENCE – GHI’s metrics were developed by physicians and scientists in the fields of immunology, virology, and epidemiology. In contrast, local health districts have a board of health appointed by county commissioners within that region, so the ratings can be impacted by local politics and outside pressures.
TIMING – GHI’s ratings are based on a seven-day rolling average and are updated daily, with a 24-hour delay built in to assure the stability of the data. In contrast, the local public health districts only reassess their risk/color ratings every two weeks and their data is based on a 14-day rolling average. This gap can hide a big surge in infection.
MITIGATION vs. SUPPRESSION – SCPHD’s ratings set a lower bar. They aim for mitigation—keeping the size of current outbreaks from growing, in order to keep our hospitals from being overwhelmed. In contrast, GHI’s ratings aim for suppression—greatly reducing new infections and keeping them low enough to safely open public life again. Following GHI ratings significantly increases the chances we can go back to school full time sooner without increasing the number of people put at risk or having to suddenly switch to all remote learning due to an outbreak.
EXPERIENCE – Local public health districts in Idaho have only been rating county risk levels for two-plus weeks. GHI has been publishing data since July 1. GHI uses data obtained from the CDC, national, state, and local health departments.
MIXED DATA – SCPHD uses the districtwide case-positivity rate (they do not have this data at the county level). Because Blaine County has a much lower positivity rate right now, it conceals the risk in other counties in our public health district.
PERTINENT DATA – SCPHD places the most weight in terms of color rating on hospital capacity, which is the ability to treat all incoming patients, not just COVID-19 positive patients. This figure will only change when every other metric is at a critical level. Because it is classified as “Green” across all counties, it reduces the color ratings of counties with other, more pertinent, transmission risks.