By Eric Valentine
In the beginning was baseball, and the sport was good. That is, until science came along.
By the late 1980s, allegations of betting on baseball by its all-time hits leader—Pete Rose—and speculation about steroid use amongst the players rose. Incidentally, by the late 1990s, homerun numbers rose too. And it was great, to watch at least.
Ratings skyrocketed as two men—Mark McGwire and Sammy Sosa—passed Babe Ruth’s legendary 60 homeruns in a season and then Roger Maris’s 61* too. By the 2000s, the famed New York Yankees had resurrected to dominate Major League Baseball, landing in the World Series in 1996, 1998, 1999, 2000 and 2001. They won all but the last one.
Baseball nerds were playing in fantasy leagues, creating a whole side industry. Meanwhile, real-life general managers—especially ones in smaller markets—were on their knees, begging for a salary cap across the sport, so that the likes of Oakland and Kansas City could compete against New York, Chicago, Boston, L.A.
The nerds with all their fantasy numbers became—for the most part—a part of the solution. That’s because as the players—for the most part—stopped using steroids, baseball statistics went on them. Advancements in video technology, computing, statistical analysis, and more created—for the most part—something called sabermetrics.
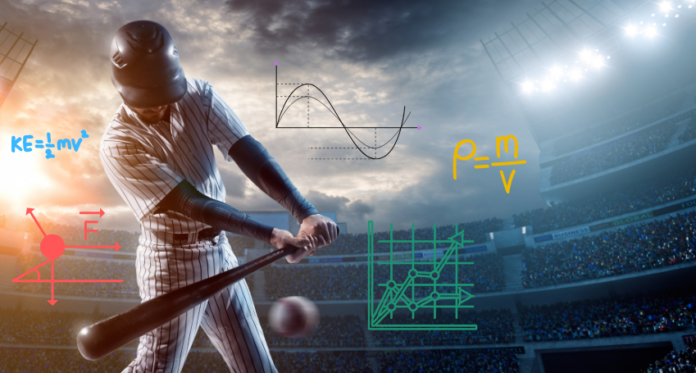
Sabermetrics is the data-driven analysis of baseball performance that uses statistics and physics—for the most part—to improve player performance as well as predict player performance. It was invented—for the most part—by a genius statistician named Bill James using the objectivity of science to understand the game, rather than the subjectivity of our eyes. And it works! For the most part, of course.
An early adopter of sabermetrics were the Oakland A’s. Soon after their adoption, and right after losing three key all-star players to big-market teams, they switched over to a sabermetrics way of fielding their team. They won over 100 games that season and set what was then an American League record, winning 20 games in a row. The famed 1927 Yankees only had won nine in a row. However, unlike those Yankees, the A’s never won the championship and they didn’t even get to the World Series.
The Odds Are Strange
Last summer, while vacationing in New York and waiting deep back in line at one of Manhattan’s most-prized bagel shops (Ess-a-Bagel), the man behind my friend and I struck up a conversation. His name was Andy Andres, a friend and colleague of James, who himself launched the first collegiate course on sabermetrics at Tufts University just outside of Boston and works as a datacaster and data analyst for Fenway Park and BaseballHQ.com, respectively.
I was working on a screenplay at the time titled Ted’s Head. It was about the baseball legend and cryogenically frozen head of Ted Williams, wherein scientific advancements bring him back to life so he can do what eluded him his entire World War II-shortened career—finally win a World Series and pad his stats to prove he was the greatest hitter to have ever lived.
As if Andres’ baseball résumé wasn’t enough, his academic version includes a master’s degree in physiology from Harvard University and a Ph.D. in nutritional biochemistry and physiology from Tufts. Suddenly, I was having a bagel lunch on the Upper East Side with a potential technical consultant for Ted’s Head. What were the odds?
Andres asked my friend and I a question about the 2020 World Series, which our favorite team—the Los Angeles Dodgers—won. He said, “Did the Tampa Bay Rays (the Dodgers’ losing opponent) make the right decision in Game 6, when they took Blake Snell out of the game?”
Some quick background: Snell pitched five scoreless innings and struck out nine Dodgers batters while walking none. He had given up just one hit. But enter sabermetrics, something the small-market Rays used to its max all season long. The data makes it clear: once a pitcher goes through the opposing team’s lineup twice, his effectiveness drops off significantly. Snell was about to see the heart of the Dodgers lineup for the third time. So Snell was taken out. The decision went against everything anyone who ever played any sport would ever instinctively do. Long story short: Snell’s replacements got touched up for two runs and the Dodgers won the World Series.
So, the decision was wrong. Right? Andres said the decision was right, because it was made using the right information at the right time. Until we learn how to travel into the future, making decisions based on the past is the only proper way to decide. Yet that’s problematic for me because of something else Andres said that day: “The teams who use sabermetrics the most are the Dodgers, Yankees, San Francisco Giants, and Tampa Bay Rays.” All of them have had remarkable seasons over the last several years, only one has garnered a championship.
I believe the problem comes down to sample size. Over a season—162 games—there’s a large amount of data. Over five games (early-round playoffs) and seven games (later-round playoffs), the sample size is too small. And, the stage is larger and louder, the stakes very high. Instincts take over and what matters at that point isn’t the math, it’s individual nature and team chemistry. Winners rise to the occasion and are named champions well-deserved.
On November 8, voters across the country will have to make a number of decisions regarding who will champion their cause or two. Some will do so sabermetrically, others by instinct and chemistry. Be aware of which type of voter you are, and may you get what you deserve.


